
EP6: When Metrics Backfire - Exploring Goodhart's Law in Engineering Contexts
"When a measure becomes a target, it ceases to be a good measure."

"When a measure becomes a target, it ceases to be a good measure." This elegant observation, known as Goodhart's Law, captures one of the most persistent challenges in engineering productivity measurement. Named after economist Charles Goodhart, this principle explains why so many well-intentioned metric initiatives ultimately fail to improve—and sometimes actively harm—engineering organizations.
Understanding Goodhart's Law
Goodhart originally formulated his law in the context of monetary policy, observing that once a specific economic indicator was targeted by policymakers, it would lose its reliability as an indicator. The broader implication, which applies powerfully to engineering contexts, is that when people know they're being measured on a specific metric, they will optimize their behavior to improve that metric—often at the expense of the underlying goal the metric was meant to serve.

Goodhart's Law states that "when a measure becomes a target, it ceases to be a good measure." This principle explains why metrics often lead to unexpected and counterproductive behaviors.
This phenomenon occurs because:
Metrics are proxies: Any metric is an imperfect proxy for what we actually care about (like value delivery, quality, or innovation)
Optimization is natural: People naturally optimize for what they're measured on, especially when incentives are attached
Gaming is inevitable: When metrics affect rewards or status, people find ways to improve the metric without improving the underlying reality
The Cobra Effect in Engineering
The "Cobra Effect" is a vivid illustration of Goodhart's Law, named after a colonial British policy in India. The British government, concerned about the number of venomous cobras, offered a bounty for each dead cobra. Initially, this reduced the cobra population, but enterprising individuals began breeding cobras to collect the bounty. When the government discovered this and ended the program, the breeders released their now-worthless cobras, resulting in a larger cobra population than before.
In engineering contexts, we see similar unintended consequences when metrics become targets:
Example 1: The Code Coverage Catastrophe
A team sets a target of 80% code test coverage, believing this will improve quality. Engineers respond by:
Writing tests for the simplest code paths to maximize coverage metrics
Avoiding complex but critical code because it's harder to test
Creating "empty" tests that execute code but don't verify behavior
The result: The coverage metric reaches 80%, but actual quality doesn't improve—and may even decline as engineers focus on hitting the metric rather than writing meaningful tests.
Example 2: The Velocity Vortex
A team is measured on story points completed per sprint. Over time:
Story point estimates inflate as teams realize higher numbers look better
Engineers prioritize high-point, low-effort stories over more valuable work
Technical debt accumulates as teams avoid complex refactoring that might slow velocity
The metric shows "improved productivity" while actual delivery capability declines
Example 3: The Deployment Delusion
An organization sets a goal of increasing deployment frequency, inspired by DORA metrics. Teams respond by:
Breaking changes into unnecessarily small pieces to increase deployment count
Deploying trivial changes to boost the metric
Rushing code through review to meet deployment targets
Creating deployment automation that sacrifices safety for speed
The deployment frequency metric improves dramatically, but the actual goal—delivering value to customers more quickly—isn't achieved.
The Metric Corruption Cycle
When metrics backfire, they typically follow a predictable pattern:
Introduction: A metric is introduced to measure something important
Awareness: Teams become aware of the metric and its importance
Adaptation: Behavior shifts to optimize for the metric
Corruption: The metric no longer reflects the underlying reality
Consequences: Unintended negative outcomes emerge
Reaction: Leadership either doubles down or abandons the metric
Repetition: A new metric is introduced, and the cycle begins again
This cycle is particularly damaging because it creates metric cynicism—engineers learn to view all metrics as management fads to be gamed rather than tools for improvement.
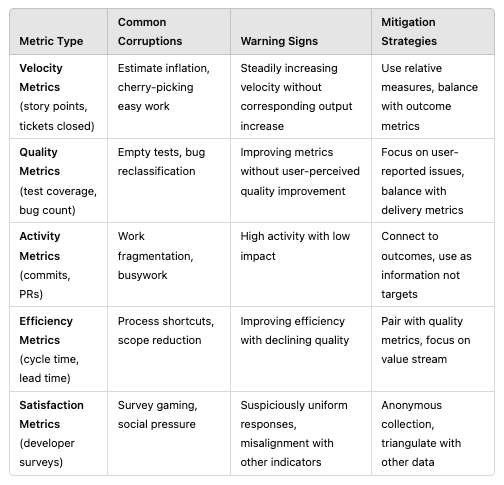
The Metric Corruption Matrix
Different types of metrics are susceptible to different forms of corruption. Understanding these patterns can help organizations anticipate and mitigate potential issues:
Case Studies: When Engineering Metrics Backfire
Case Study 1: The Feature Factory
A product company implemented a metric tracking the number of features shipped per quarter. Teams were recognized and rewarded based on this metric. Within a year:
Feature quality declined as teams rushed to ship
Features became smaller and less ambitious
Customer-reported issues increased
Product became bloated with rarely-used features
Engineers focused on quantity over impact
Despite "shipping more" according to the metric, customer satisfaction and revenue growth both declined.
Case Study 2: The Bug Bounty Backfire
A software company, concerned about quality, implemented a metric focused on reducing the bug backlog. Teams were evaluated on the percentage reduction in open bugs. The results:
Engineers reclassified bugs as "enhancements" or "won't fix"
New bugs were logged informally rather than in the tracking system
Easy bugs were prioritized over critical ones
The metric showed dramatic "improvement" while actual quality stagnated
Case Study 3: The Deployment Disaster
A tech organization mandated daily deployments for all teams, believing this would improve agility. The consequences:
Teams deployed trivial changes to meet the requirement
Important but complex changes were broken into unnecessarily small pieces
Testing was rushed to meet deployment schedules
Production incidents increased
Engineers spent more time managing deployments than writing code
The deployment frequency metric improved dramatically, but overall productivity and quality suffered.
Principles for Avoiding Metric Corruption
To harness the power of metrics while avoiding the pitfalls of Goodhart's Law, organizations can follow these principles:
Use metrics for information, not targets: When metrics are used primarily for learning rather than evaluation, the incentive to game them is reduced.
Employ multiple complementary metrics: No single metric can be gamed without affecting others if they're well-designed to balance each other.
Rotate metrics periodically: Changing which metrics receive attention prevents long-term gaming and provides multiple perspectives.
Combine quantitative and qualitative data: Numbers alone can be misleading; narrative context helps understand what's really happening.
Involve engineers in metric selection: Those closest to the work understand how metrics might be gamed or misinterpreted.
Focus on trends over absolute values: The direction of change is often more informative than the specific number.
Maintain metric skepticism: Always question whether improvements in metrics reflect real-world improvements.
Beyond Goodhart's Law
Goodhart's Law isn't a reason to abandon metrics—it's a reason to use them wisely. By understanding the ways in which metrics can be corrupted, organizations can design measurement systems that provide valuable insights while minimizing unintended consequences.
The key is to view metrics as tools for learning rather than mechanisms of control. When metrics inform rather than drive behavior, they can help engineering organizations improve without triggering the counterproductive dynamics that Goodhart observed.
In our next post, we'll explore Campbell's Law—a close cousin of Goodhart's Law—and how it applies specifically to social systems like engineering teams.